Sagayama/Ono Laboratory (Lab. #1), Department of Information Physics and Computing,
Graduate School of Information Science and Technology, The University of Tokyo.
(Last updated: 2007.03.21)
Isotropic Noise Field Orthogonalization in Array Signal Processing
and its Application to Power Spectrum Estimation
 Hikaru Shimizu กค
 Nobutaka Ono กค
 Kyosuke Matsumoto กค
 Shigeki Sagayama
Abstract
[Motivation] There exist several effective noise suppression
methods for noisy environments such as spectral subtraction,
beamformer (Delay-and-Sum array), and null beamformer, but these methods
suffer from severe limitations. Spectral subtraction needs to be able to
observe only noise, while the D-S beamformer requires impractical
array size for adequate separation performance, and the null beamformer
can suppress noise coming from only up to (number of microphones -1)
directions
[Focus] In this research, we aim at developing a noise
suppression method to be applied to speech
recognition, and thus need to be able to estimate the power spectrum of
one target signal from a given direction in a noisy environment where
noise is arriving from all directions, without the necessity to observe
noise separately, while keeping a pratical array size.
[Method] As an idealization of a noise field in which noise
arrives from all directions, we define the Isotropic Noise Field. In an
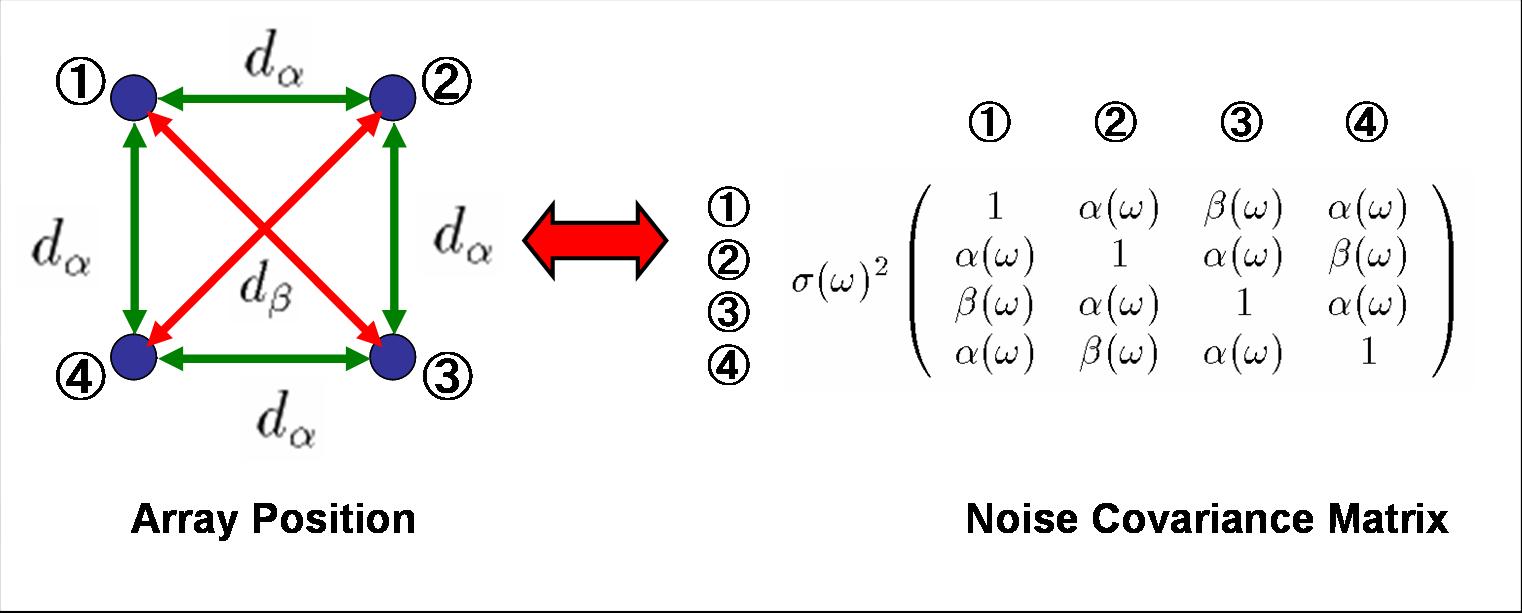
Isotropic Noise Field, the noise covariance matrix is expressed as
in Fig. 1. We proposed a new spectrum estimation method, in which we
estimate the power spectrum using the noise-free cross-spectrum acquired by
orthogonalization of the noise field. In this research, we proved that
the noise covariance matrix of an Isotropic Noise Field is diagonalized by
the same unitary matrix independently of the discrete values of the
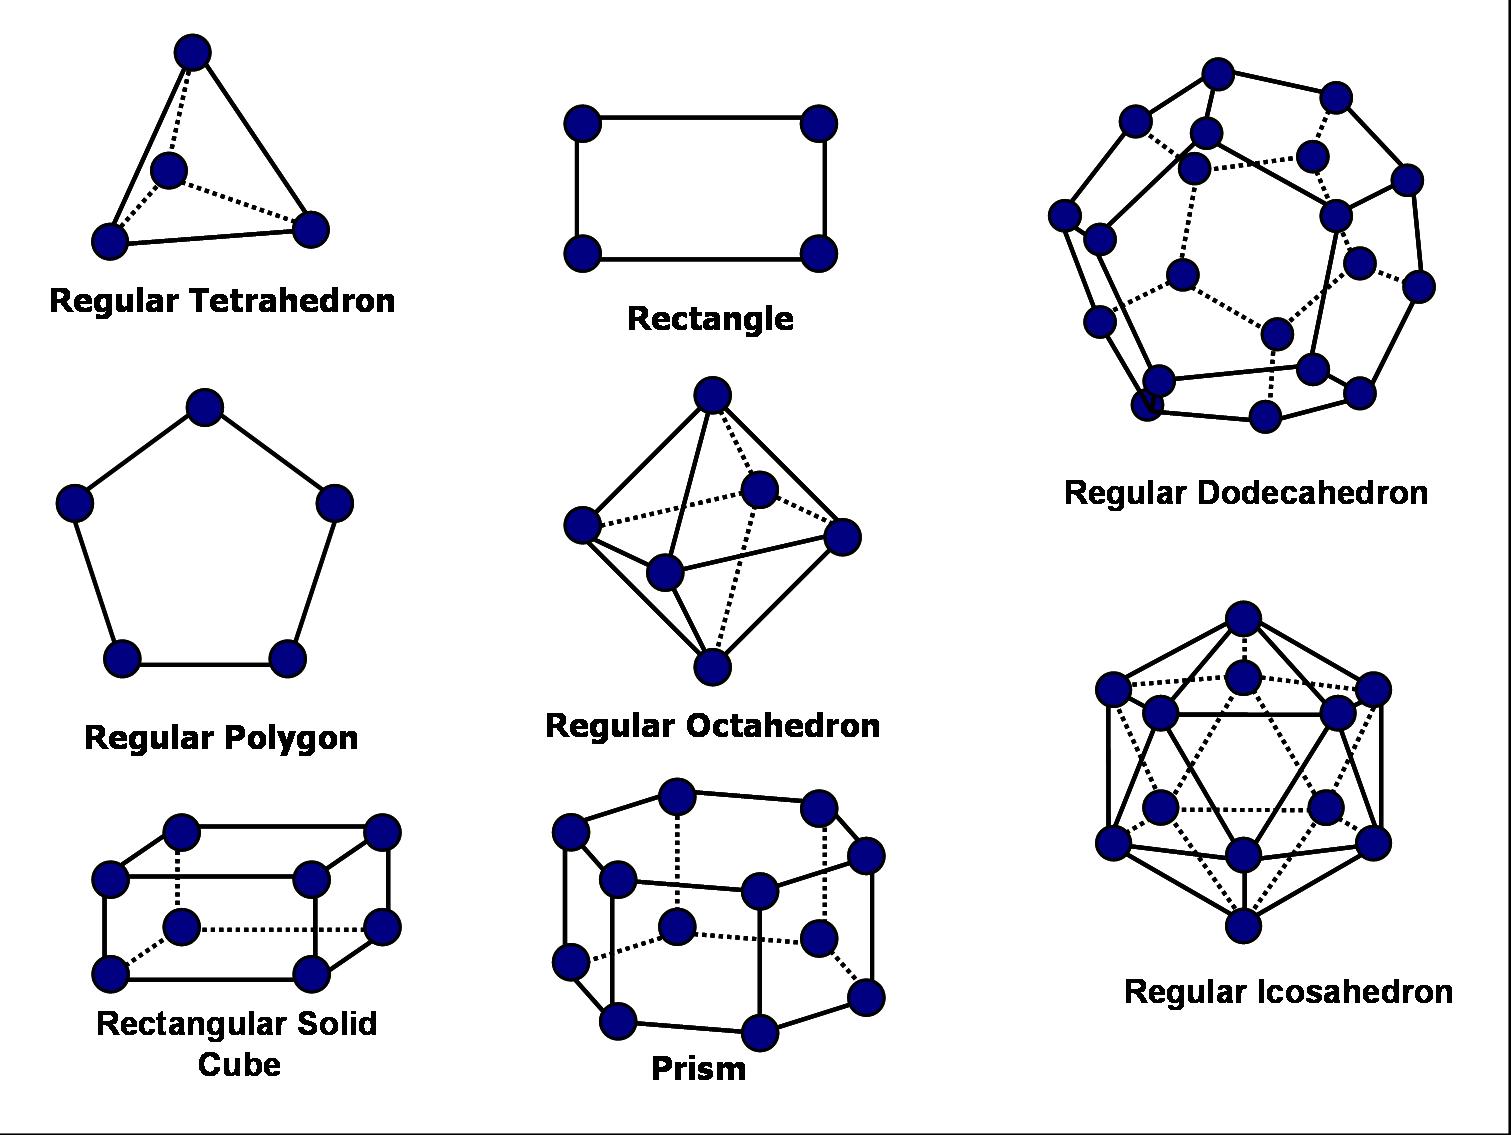
matrix, when the position of the microphones in the array is set as
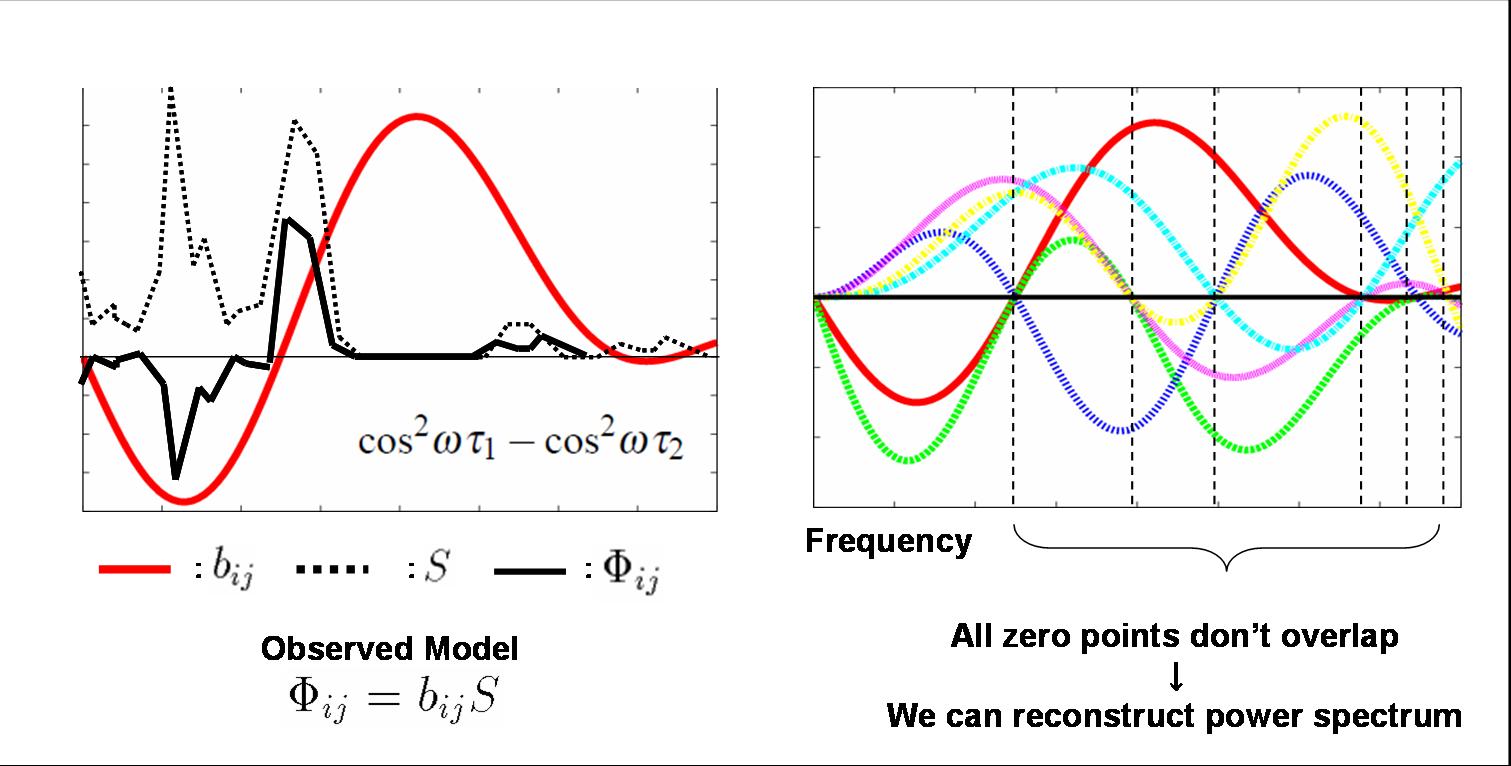
shown in Fig. 3. The observed cross-spectrum is modeled as a filtered
version of the power spectrum, and we can reconstruct the
power spectrum by estimating the corresponding inverse filter.
[Characteristics] This method is based on a very general idea,
the symmetrical setting of the sensor array, which could be used in many
areas. In signal processing, we expect this method to be applied
effectively to reverberation fields.
 |
 |
 |
| Fig. 1. Structure of the observed
noise covariance
matrix for a square microphone array.
| Fig. 2. Sensor positions for which
the proposed method can be applied.
| Fig. 3. Relation between power spectrum and observed cross-spectrum.
|
Keywords: Isotropic Noise Field, Symmetry, Orthogonalization, Cross-Spectrum, Spectrum Estimation
Bibliography
This idea and experimental results based on simulation were reported in Japanese [Shimizu2007ASJ03]
- [Shimizu2007ASJ03]
Hikaru Shimizu, Kyosuke Matsumoto, Nobutaka Ono, Shigeki Sagayama,
``A Theory of Array Signal Processing to Orthogonalize
Isotropic Noise Field and its Application to
Power Spectrum Estimation,'' Proc. of ASJ Spring
Meeting, pp.569-570, Mar., 2007. (in Japanese)
[PDF file]
Experimental results based on simulation
-
We simulated an Isotropic Noise Field by adding noise
from all around the microphone array. We generated 2
kinds of noise field as follows:
1. Add noise from 64 directions. (each noise has the
same power spectrum, but a different waveform in the time domain)
2. Using 50 different speech signals, add 5 superposed signal from 10 directions.
Experimental condition 2 is thought to be more practical than 1.
-
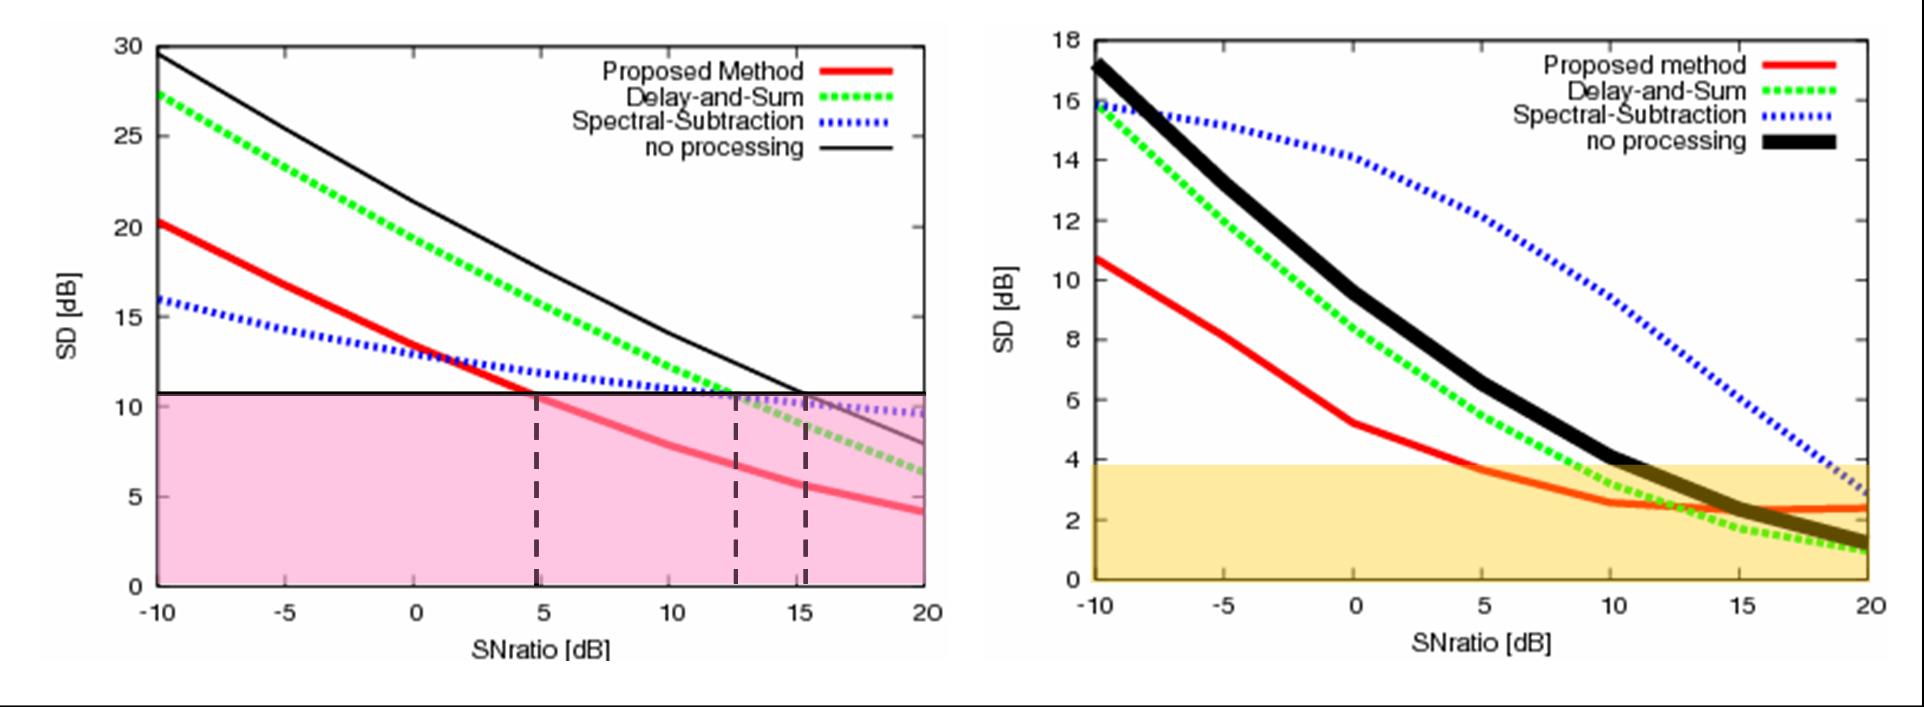
We use the Spectral Distortion measure (SD) as a general
evaluation function for the estimated power spectrum. We
evaluate SD for different SN ratios of the observed signal.
-
As comparison methods, we use Spectral Subtraction and
Beamforming by Delay-and-Sum Array with the same number
of microphones. We provide the averaged power spectrum at all
observation times for Spectral Subtraction, and use basic
phase compensation for the Delay-and-Sum Array.
 |
 |
 |
| Fig. 4. Evaluation by SD for
experimental condition 1 (left) and 2 (right). Both
graphs show the effectiveness of the proposed
method. |
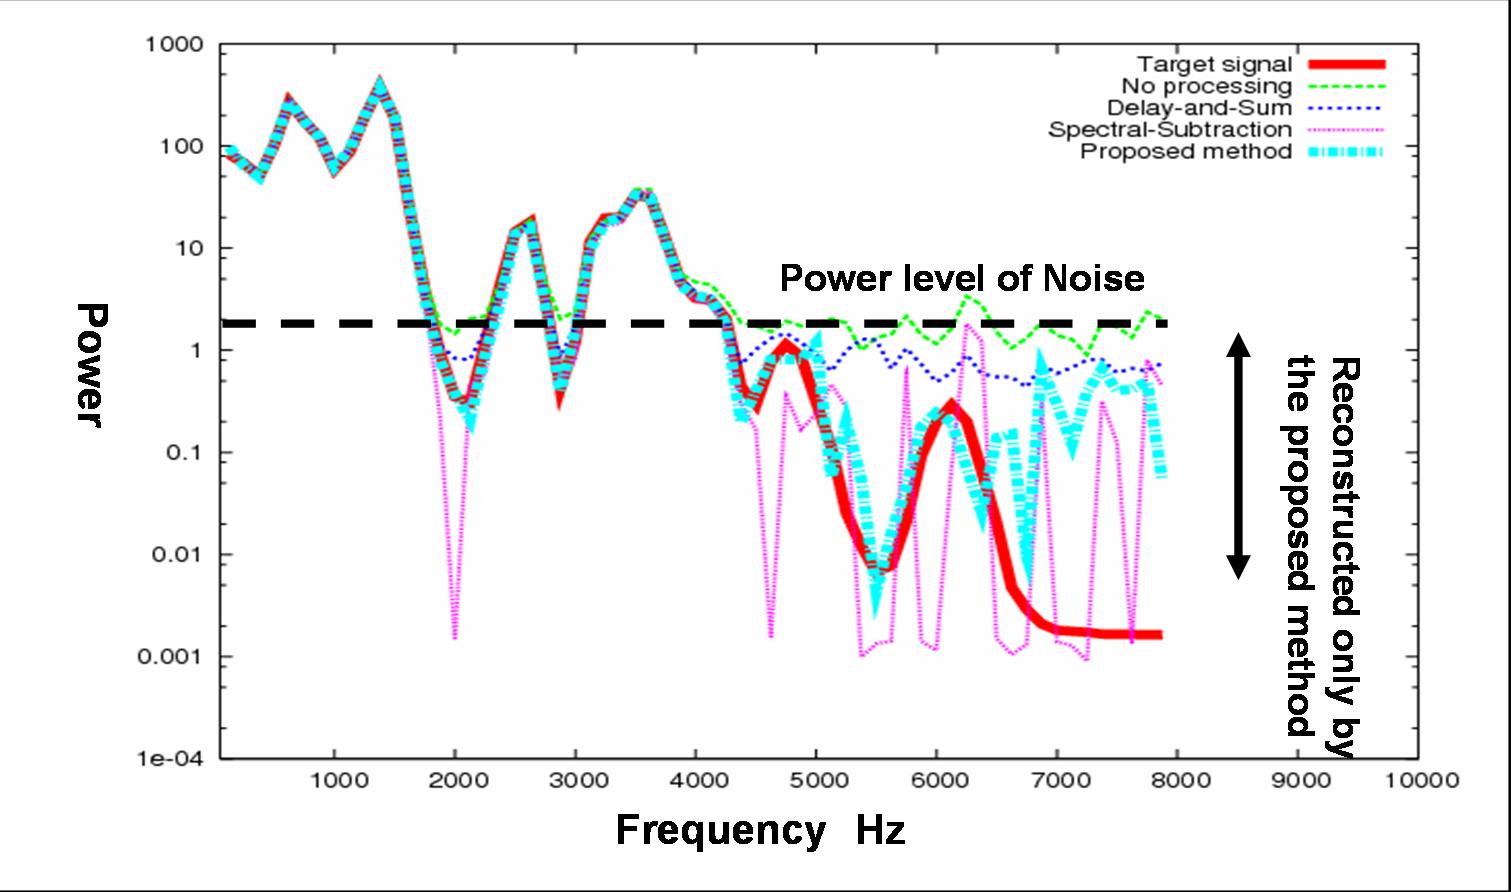
Fig. 5. Estimated power spectrum. The
true power spectrum is shown in red, the spectrum
estimated by the proposed method in light blue, the
observed spectrum in green, the spectra estimated by
Delay-and-Sum in dark blue and by Spectral-Subtraction
in pink. |
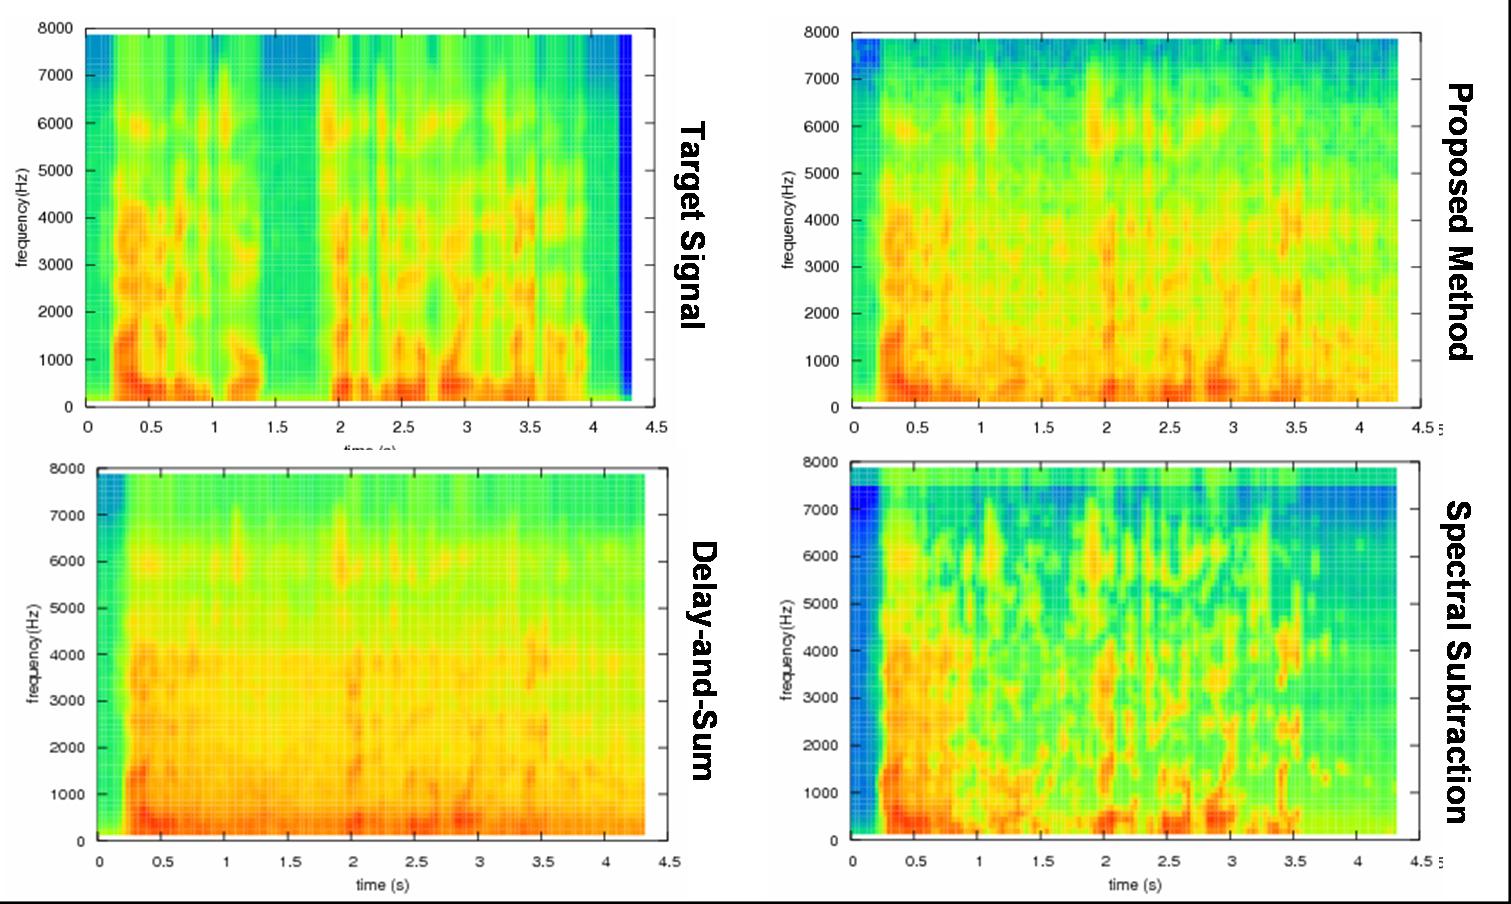
Fig. 6. Comparison of estimation
accuracy by spectrograms. Horizontal axis represents
time, vertical axis represents frequency. These
spectrograms also show the effectiveness of the proposed
method. |
[ Back to Lab Home ]


 Hikaru Shimizu กค
 Nobutaka Ono กค
 Kyosuke Matsumoto กค
 Shigeki Sagayama